
Plot SSM CI accuracy across the amplitude ladder
Source:R/ssm_ci_oop.R
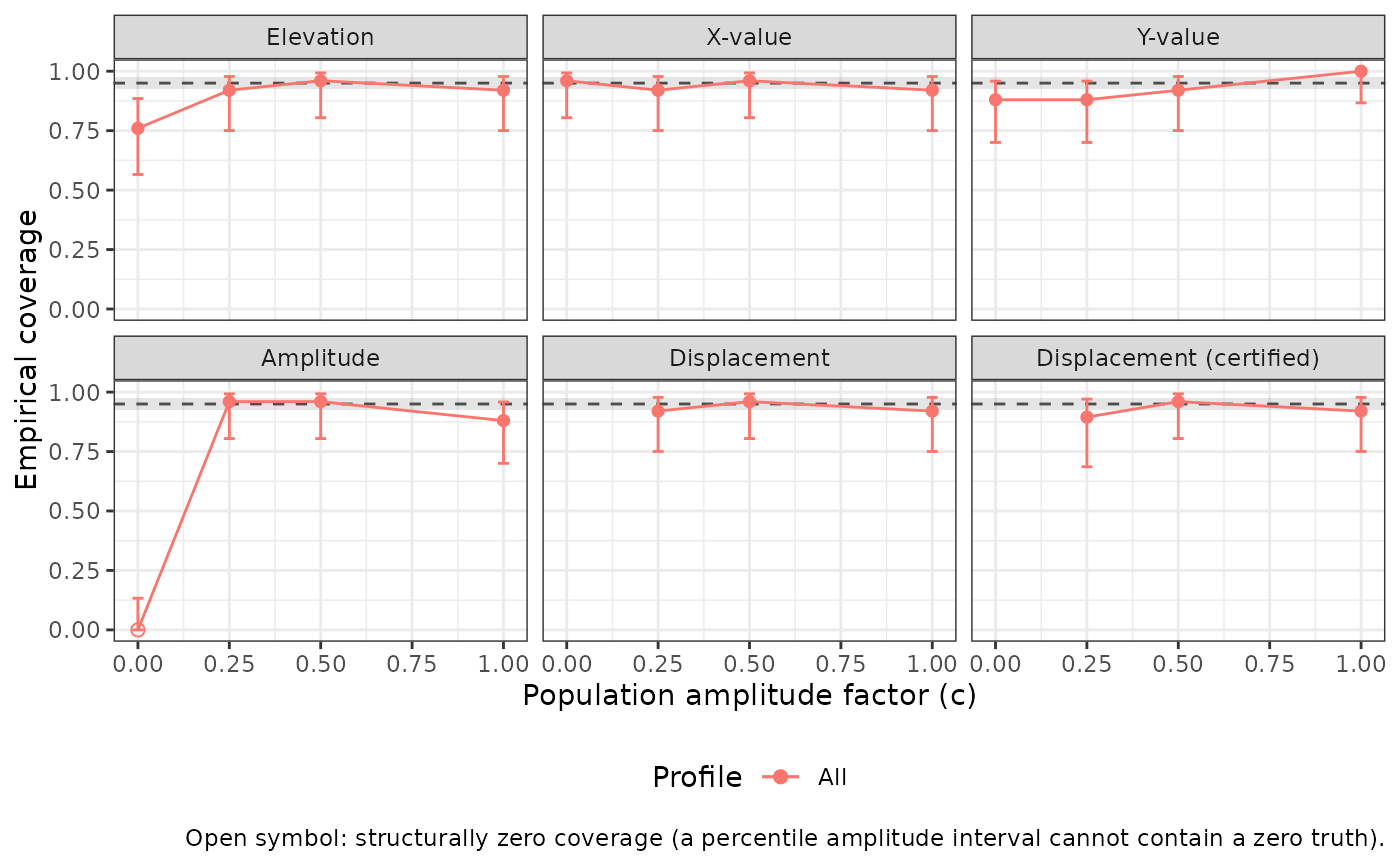
plot.circumplex_ci_accuracy.RdDraw the empirical coverage from an ssm_ci_accuracy() run against its
amplitude-ladder conditions: one panel per SSM parameter (including
displacement conditional on guardrail certification), one line per profile
row, with 95% Wilson score intervals as error bars, Bradley's (1978)
liberal robustness band shaded, and the nominal confidence level as a
dashed line. Amplitude rungs whose coverage is structurally zero (a
percentile interval of strictly positive amplitude replicates cannot
contain a zero truth; see ssm_ci_accuracy()) are drawn as open symbols.
This is a Cartesian diagnostic plot, not a circumplex figure.
Usage
# S3 method for class 'circumplex_ci_accuracy'
plot(x, ...)
Arguments
- x
A
circumplex_ci_accuracyobject fromssm_ci_accuracy().- ...
Currently ignored.
See also
Other ssm functions:
ssm_analyze(),
ssm_analyze_long(),
ssm_ci_accuracy(),
ssm_draws(),
ssm_parameters(),
ssm_parameters_id(),
ssm_score(),
ssm_sem(),
ssm_sem_parameters(),
ssm_table(),
summary.circumplex_ssm_id()
Other visualization functions:
ssm_plot_circle(),
ssm_plot_contrast(),
ssm_plot_curve(),
ssm_plot_trajectory()
Examples
# \donttest{
data("jz2017")
set.seed(12345)
res <- ssm_analyze(
jz2017[1:200, ],
scales = c("PA", "BC", "DE", "FG", "HI", "JK", "LM", "NO"),
boots = 100
)
set.seed(23456)
acc <- ssm_ci_accuracy(res, reps = 25)
#> Warning: CPM Hessian is ill-conditioned (condition number 3.53e+17): angles may be clustered or parameters weakly determined.
plot(acc)
 # }
# }