Plot a circumplex-structure configuration
Source:R/fit_structure_oop.R
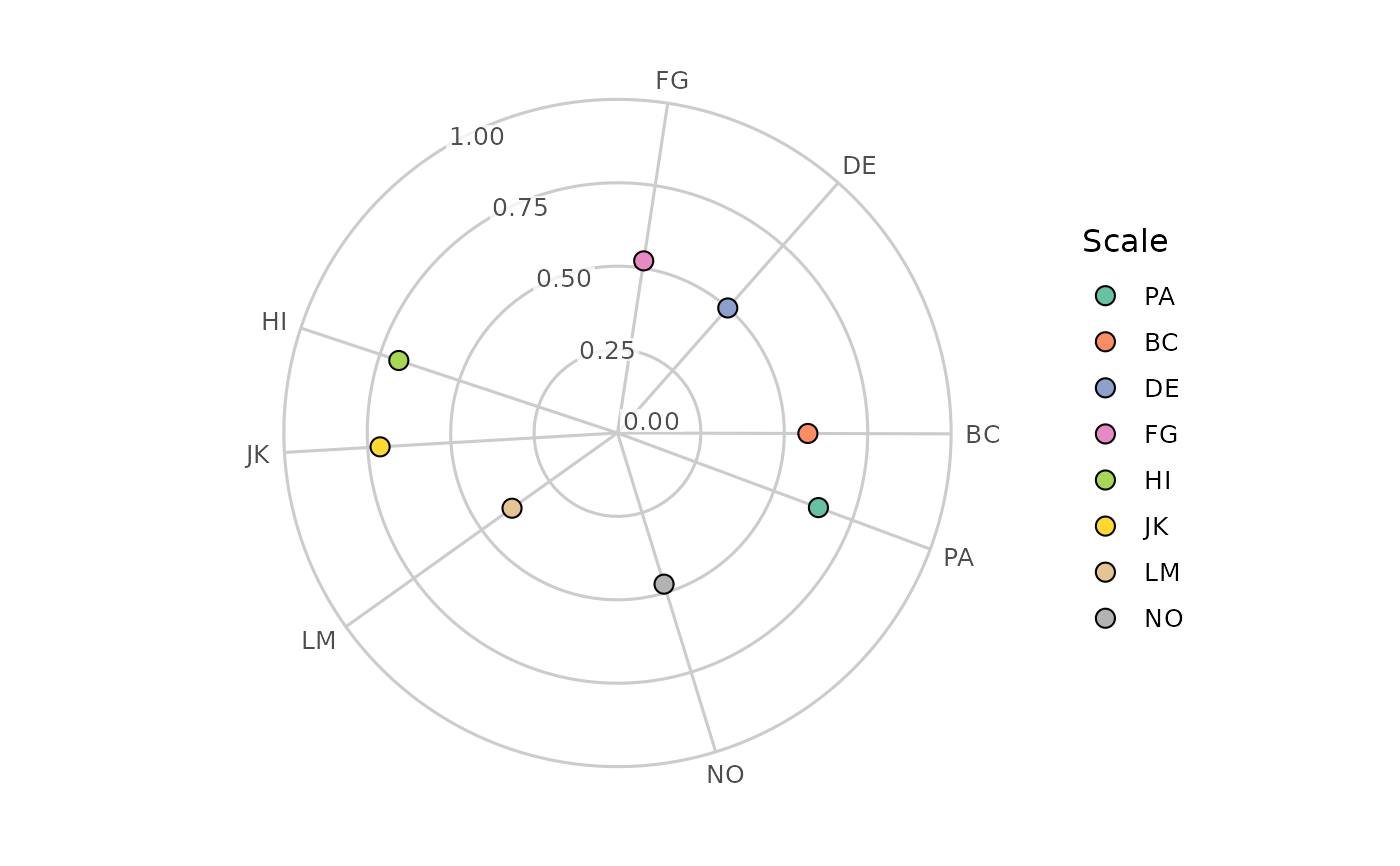
plot.circumplex_structure.RdDraw the two-factor loading configuration of a fit_structure() object on
the circular canvas from ggcircumplex(). Each scale is placed at its
estimated angle (atan2 of its two principal-axis loadings) and at a radius
given by its communality (the share of its variance on the first two
factors), so a clean circumplex shows the scales spread evenly around a ring
of similar radius, unequal axes show scales at differing radii (what the
Fisher Test measures), and simple structure shows scales bunched near a few
angles (what the Gap and interstitiality tests measure). The canvas spokes
mark the same estimated angles, labelled by scale.
Usage
# S3 method for class 'circumplex_structure'
plot(x, amax = 1, legend = TRUE, ...)
Arguments
- x
A
circumplex_structureobject fromfit_structure().- amax
A single positive number giving the communality represented by the canvas's outer ring (default = 1). Principal-axis communalities can exceed 1 in a Heywood case; when any scale's communality exceeds
amaxthe ring is expanded to contain it, so no point is ever drawn outside the canvas.- legend
A logical: draw a legend keying the colours to the scale names (default =
TRUE).- ...
Not used. Supplying an unrecognized argument produces a warning.
Examples
data("jz2017")
scales <- c("PA", "BC", "DE", "FG", "HI", "JK", "LM", "NO")
plot(fit_structure(jz2017, scales = scales))