Build an empty circular canvas – the amplitude rings, displacement spokes,
and scale labels that circumplex figures are drawn on – as a ggplot2
object. Additional layers (points, arcs, annotations) can be added to it
with +, so it serves as the reusable foundation for custom circumplex
visualizations. The package's own ssm_plot_circle() draws on the same
canvas.
Arguments
- angles
Optional. A numeric vector of the angular position (in degrees) of each circumplex scale, going counterclockwise from the right (default =
octants()). Ignored ifinstrumentis supplied.- labels
Optional. Either
NULLor a character vector of text labels to draw around the circle, one per angle and in the same order (default =NULL, which draws the numeric angles). Ifinstrumentis supplied,NULLuses the instrument's scale abbreviations.- amax
Optional. A single positive number giving the amplitude at the outer ring, which sets the amplitude-axis labels; the center of the circle is fixed at amplitude 0 (default = 0.5).
- font_size
Optional. A single positive number giving the size (in pt) of the scale and amplitude labels (default = 12).
- instrument
Optional. Either
NULLor acircumplex_instrumentobject (seeinstrument()). When supplied, the scaleanglesand (unlesslabelsis given) the scale abbreviations are taken from the instrument (default =NULL).- grid
Optional. A single string naming the canvas furniture, passed to
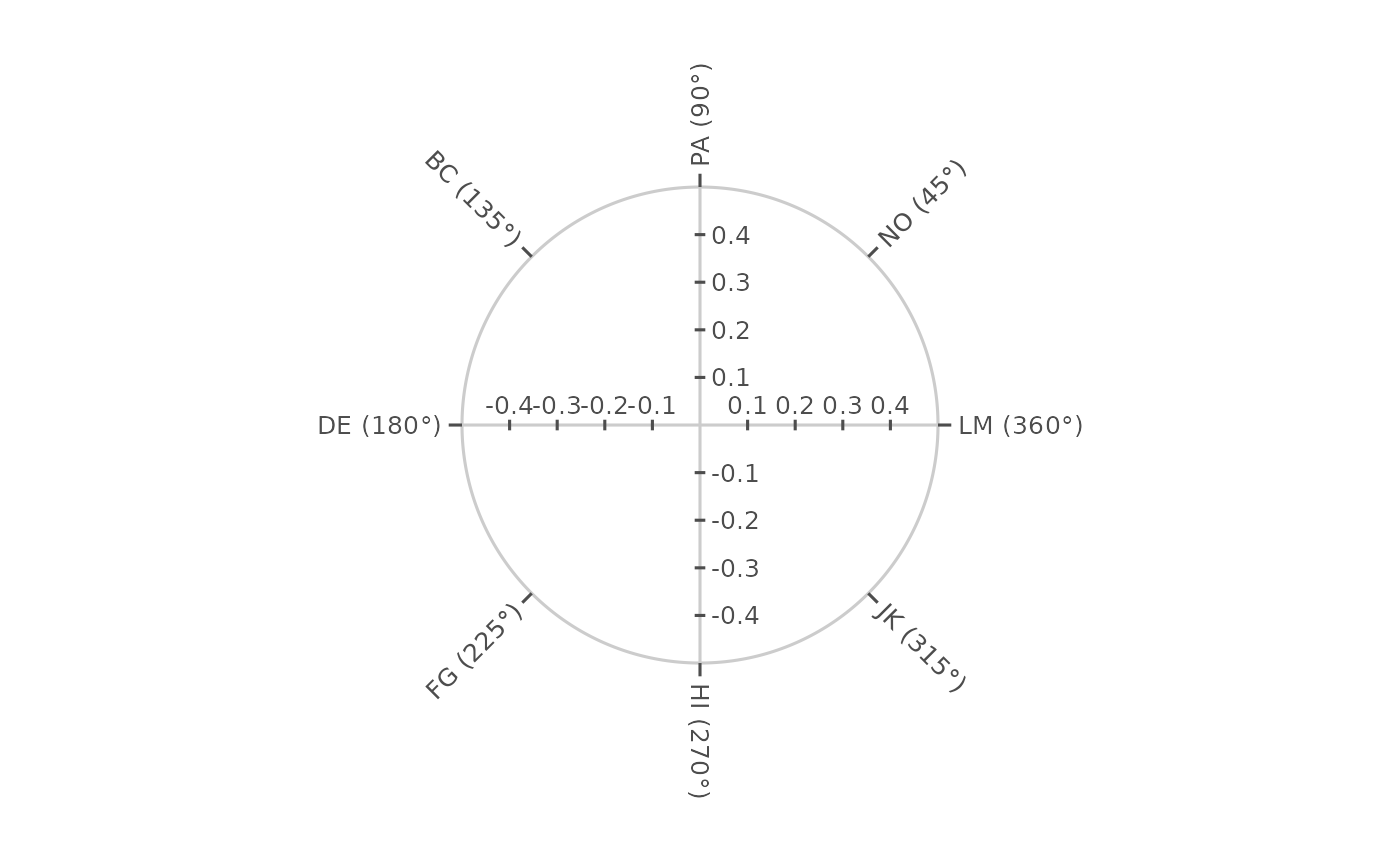
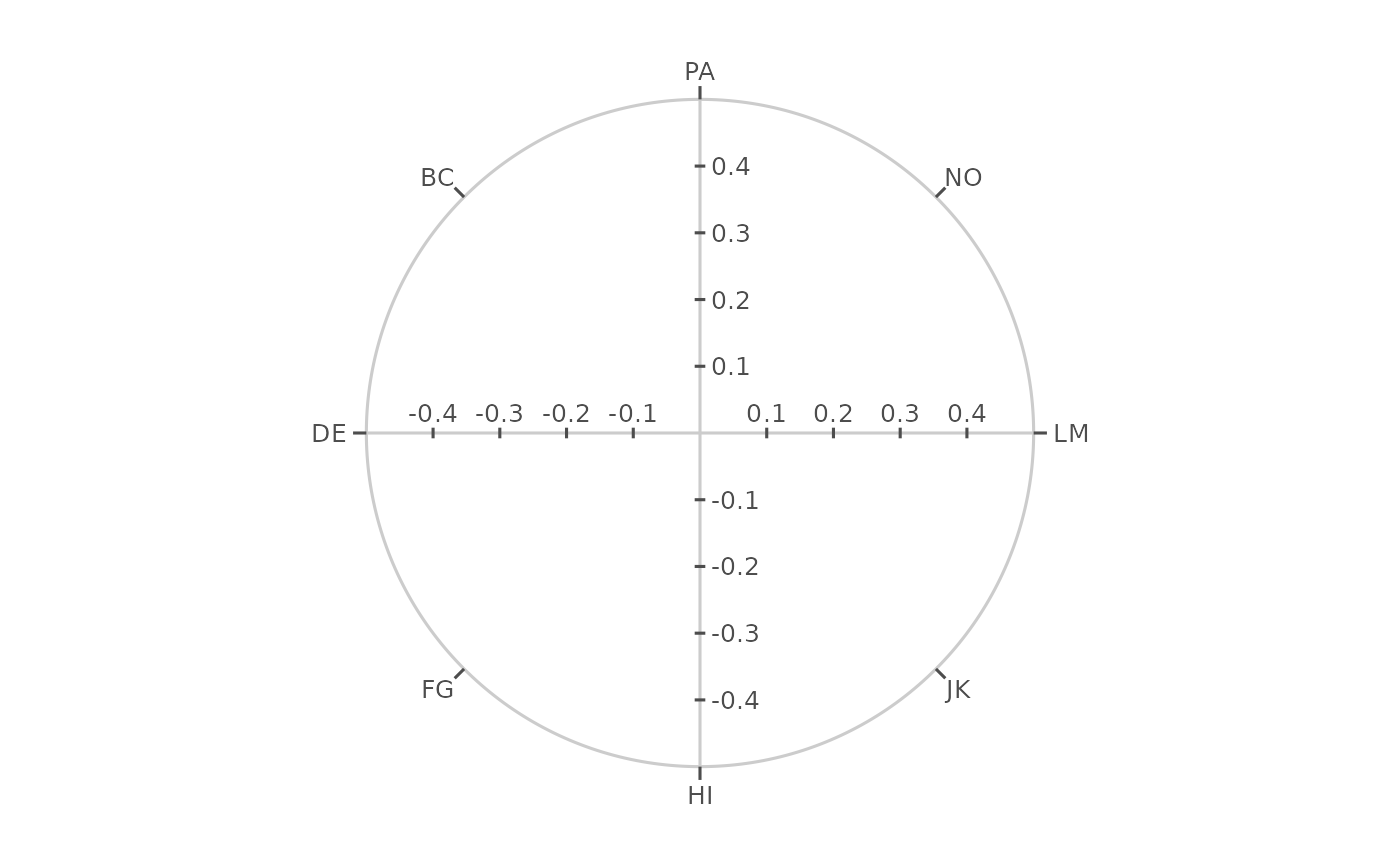
coord_circumplex()."polar"(the default) draws amplitude rings, displacement spokes and the amplitude axis."cartesian"draws one rim ring, a crosshair with a tick mark and a signed label at each amplitude break between the center and the rim on every half-axis, and tick marks outward from the rim at the scale angles (the canvas of Nagy et al., 2019). The labels on the 180 and 270 halves are negative Cartesian coordinates, not negative amplitudes.- angle_labels
Optional. A single logical, independent of
grid.TRUEappends each scale's angle to its label, in parentheses with the degree sign, the angle rounded to the nearest whole degree and the 0/360 pole written as 360, and turns each label to read along its radius (default =FALSE). It applies to text labels, fromlabelsor an instrument; the default degree labels already show the angle and are left as they are. Each side of the plot margin is widened to fit the labels that point toward it: a label reaches past a side by its length, estimated at half offont_sizeper character, times the share of its direction that points toward that side. A side that no label points toward keeps the theme's margin, so the circle can sit off-center on the page. Add+ theme(plot.margin = ...)to set the margin yourself.
See also
coord_circumplex(), which owns the transform this canvas is built
on; ssm_plot_circle(), which draws SSM results on this canvas.
Other circumplex layers:
coord_circumplex(),
geom_ssm_arc(),
geom_ssm_ellipse(),
geom_ssm_path(),
geom_ssm_point(),
scale_x_circumplex(),
theme_circumplex()
Examples
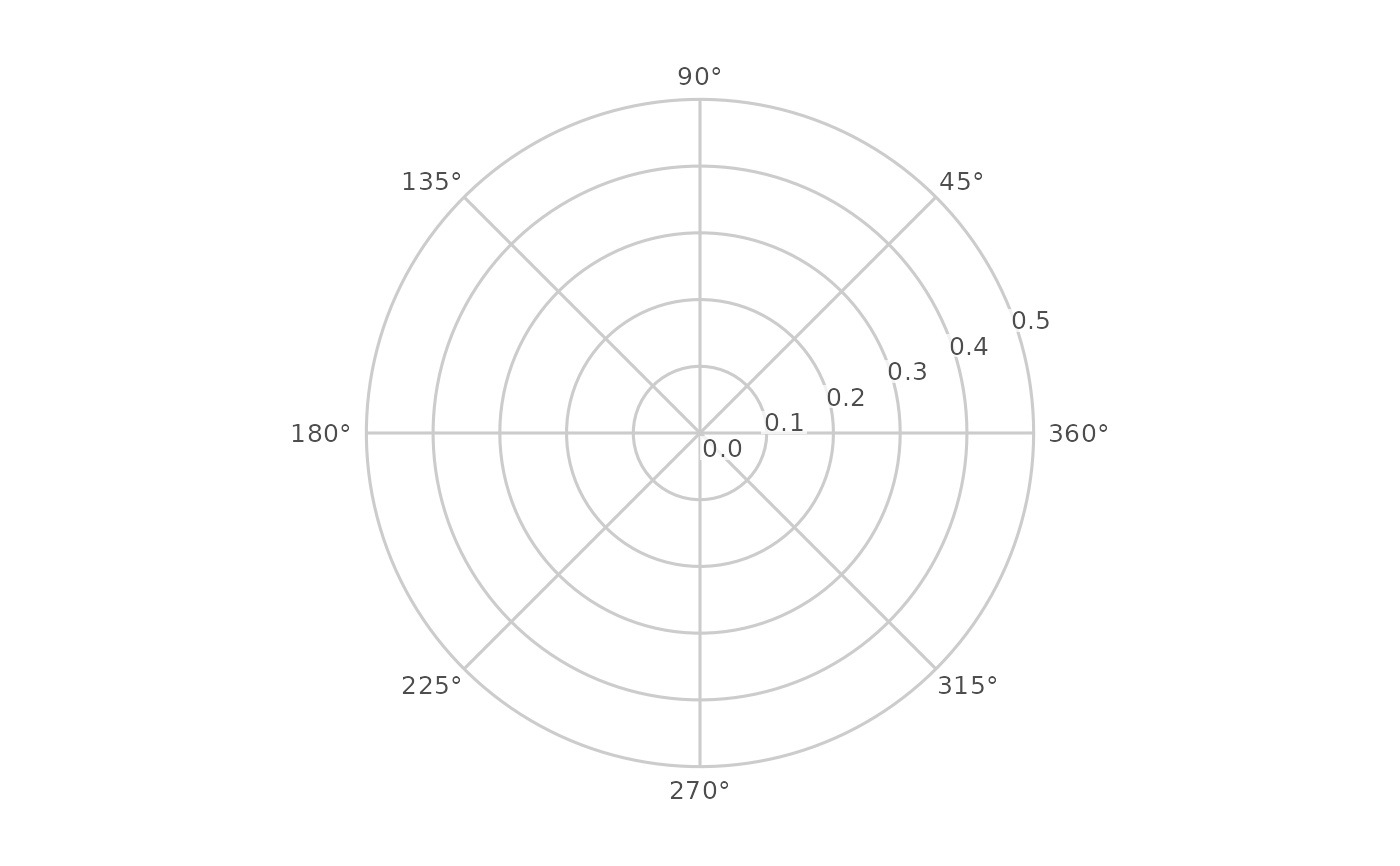
# A default octant canvas
ggcircumplex()
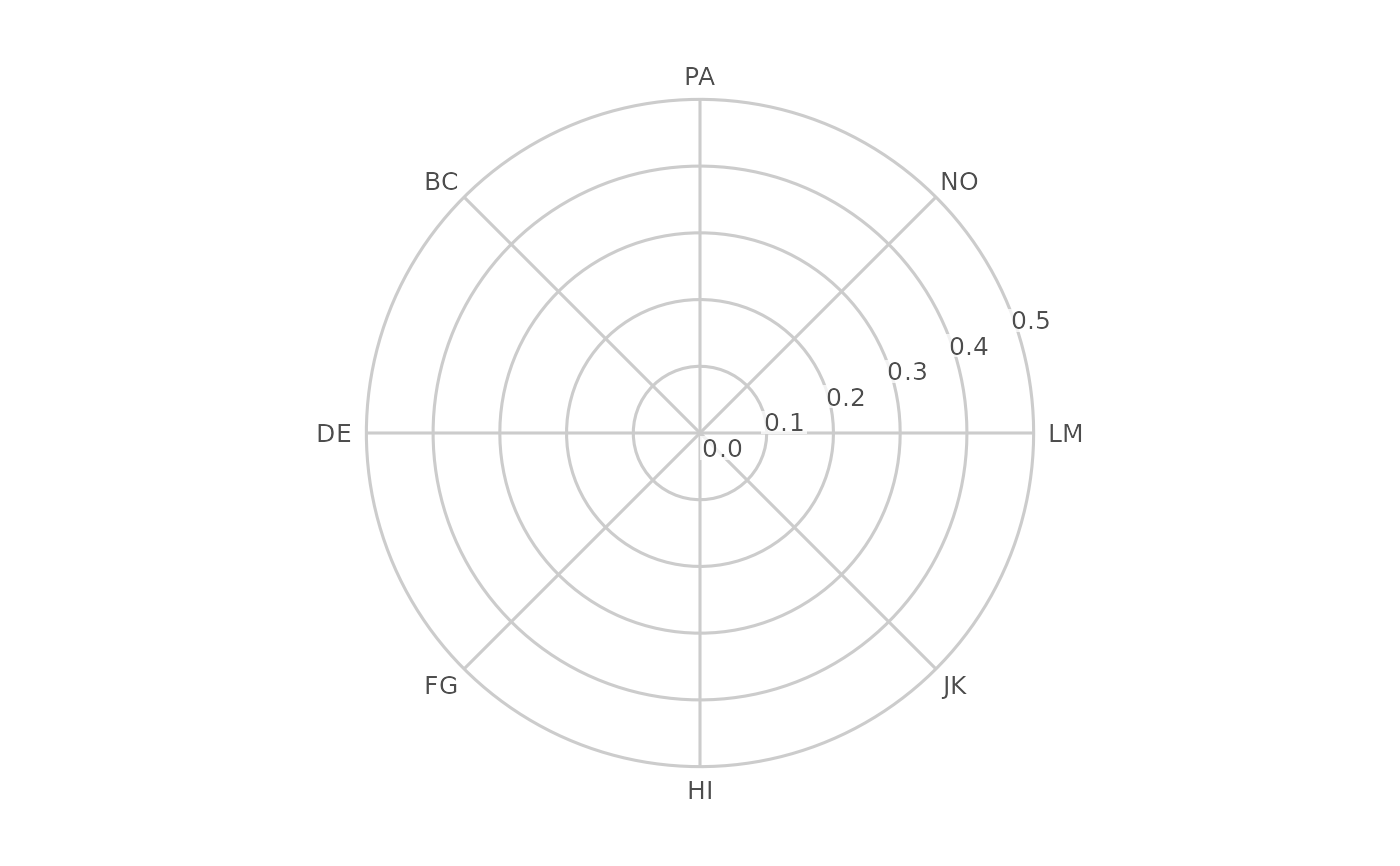
 # Label the scales with their circumplex pole abbreviations
ggcircumplex(octants(), labels = PANO())
# Label the scales with their circumplex pole abbreviations
ggcircumplex(octants(), labels = PANO())
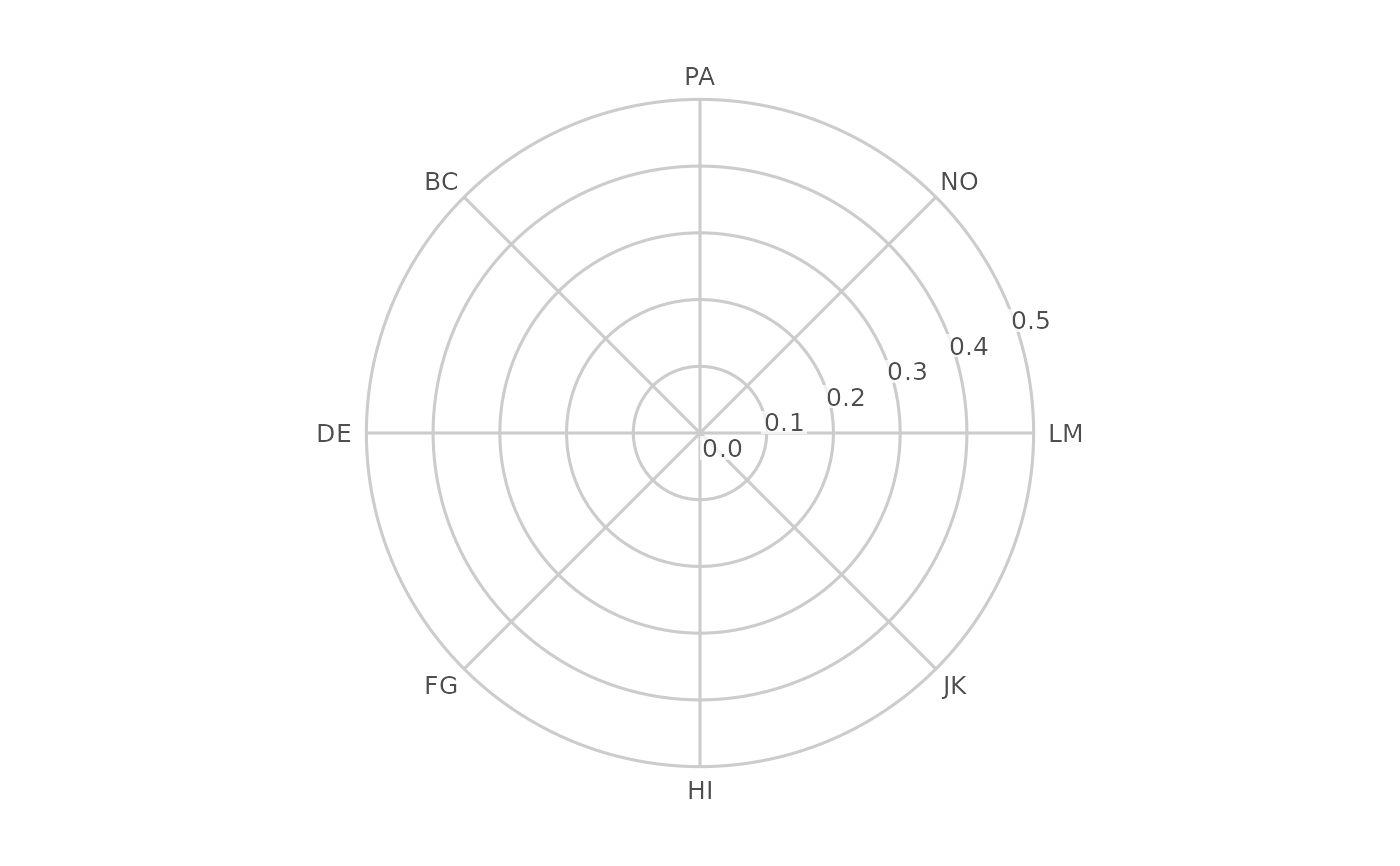
 # Derive the angles and labels from a circumplex instrument
ggcircumplex(instrument = csip)
# Derive the angles and labels from a circumplex instrument
ggcircumplex(instrument = csip)
 # A Cartesian grid: one rim ring and a labelled crosshair
ggcircumplex(octants(), labels = PANO(), grid = "cartesian")
# A Cartesian grid: one rim ring and a labelled crosshair
ggcircumplex(octants(), labels = PANO(), grid = "cartesian")
 # Each scale labelled with its angle, read along the radius
ggcircumplex(octants(), labels = PANO(), grid = "cartesian", angle_labels = TRUE)
# Each scale labelled with its angle, read along the radius
ggcircumplex(octants(), labels = PANO(), grid = "cartesian", angle_labels = TRUE)