
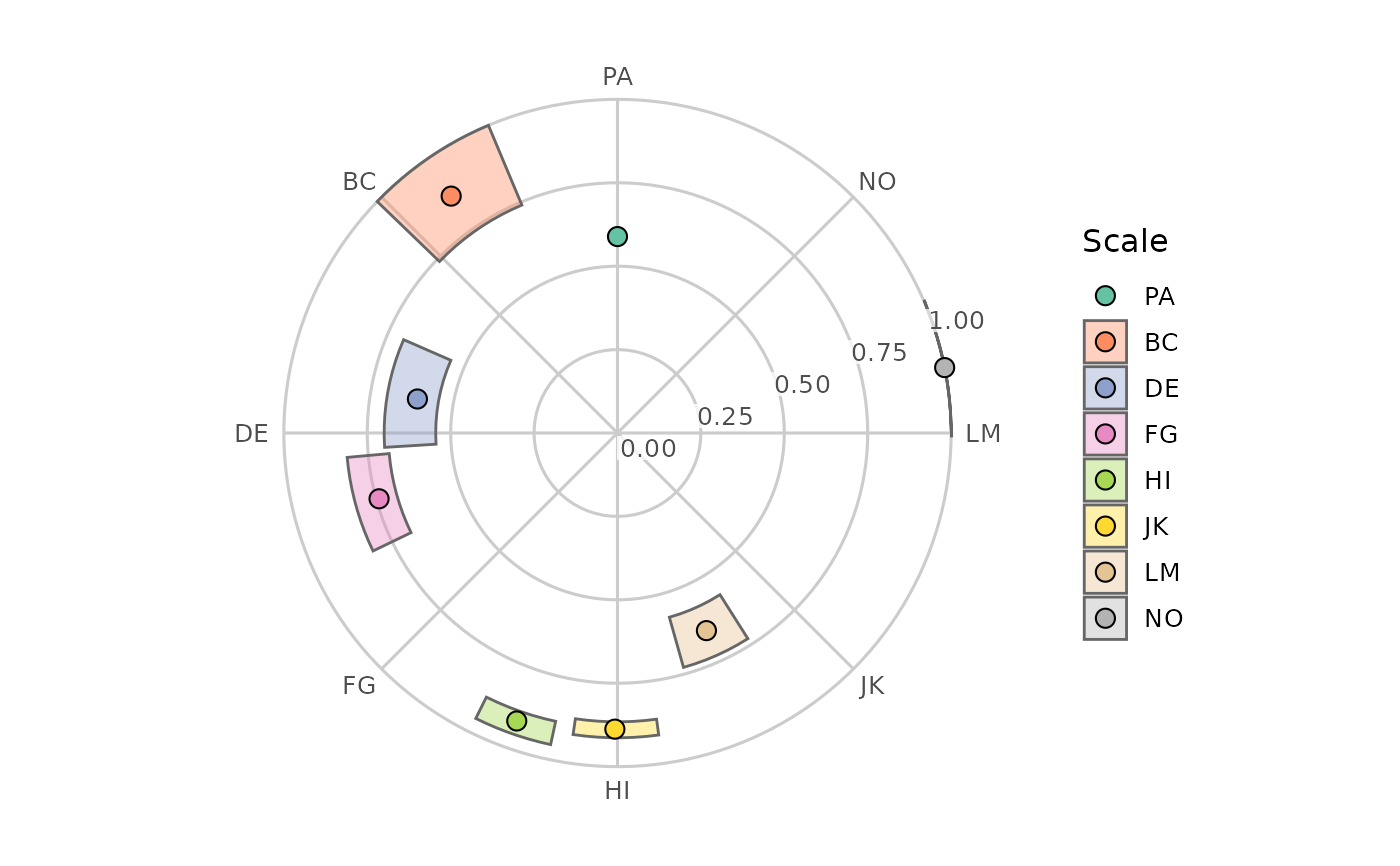
Draw the estimated item configuration of a cpm_fit() object on the circular
canvas from ggcircumplex(). Each scale is placed at its estimated angle
(\(\theta\)), at a radius given by its communality
(\(\zeta^2\), the share of
its variance explained by the common circumplex factors), so items that the
model explains well sit near the outer ring and items it explains poorly sit
near the centre. The canvas spokes mark the theoretical angles supplied to
cpm_fit(), so the gap between a point and its spoke shows how far the
estimated angle departed from the hypothesised one. Where the confidence
intervals are estimable, a wedge spans each item's angle CI (angularly) and
communality CI (radially). An interval of zero width has no area, so it is
drawn as a line instead: along the radius for a zero-width angle CI, along
the arc for a zero-width communality CI, and as a short cap across the
interval when both are zero. The cap has the same drawn length at every
radius except near the centre, where it spans at most a quarter turn and so
is shorter. A scale whose communality CI is zero at both ends has no
visible interval at the centre and is drawn as a point, with a warning.
Usage
# S3 method for class 'circumplex_cpm'
plot(x, amax = 1, angle_labels = NULL, legend = TRUE, ...)
Arguments
- x
A
circumplex_cpmobject fromcpm_fit().- amax
A single positive number giving the communality represented by the canvas's outer ring (default = 1, the maximum possible communality).
- angle_labels
Either
NULLor a character vector of spoke labels, one per scale in the fitted order.NULL(default) labels the spokes with the scale names.- legend
A logical: draw a legend keying the colours to the scale names (default =
TRUE).- ...
Not used. Supplying an unrecognized argument produces a warning.
Details
The communality axis and its labels are drawn along the midpoint of the
widest gap between spokes that holds no estimated angle (ties go to the
smallest midpoint; a point on a spoke counts as in both gaps next to it).
When every gap holds a point, the axis goes in the widest gap, as
coord_circumplex() places it by default.
Examples
# \donttest{
data("jz2017")
scales <- c("PA", "BC", "DE", "FG", "HI", "JK", "LM", "NO")
set.seed(12345)
fit <- cpm_fit(jz2017, scales = scales, boots = 100)
#> Warning: CPM Hessian is ill-conditioned (condition number 1.83e+14): angles may be clustered or parameters weakly determined.
#> Warning: 2 of 100 bootstrap resamples were excluded (0 with a degenerate or non-positive-definite correlation matrix, 2 failing the convergence acceptance criterion); the confidence intervals are based on the remaining 98 replicates and are conditional on estimability.
plot(fit)
 # }
# }