A ggplot2 coordinate system that maps Structural Summary Method
parameters onto the circular circumplex canvas: the displacement aesthetic
(degrees, counterclockwise from the right, with the 0/360 pole labelled 360)
becomes the angle and the amplitude aesthetic becomes the radius. It owns
the amplitude-to-radius scaling, so geom_ssm_point() and geom_ssm_arc()
no longer take an amax, and the canvas and data layers can never disagree.
Usage
coord_circumplex(
  amax = NULL,
  center = 0,
  r_axis_angle = NULL,
  grid = c("polar", "cartesian"),
  ...
)
Arguments
- amax
Optional. A single positive number giving the amplitude represented by the outer ring.
NULL(the default) trains it from the data (asssm_plot_circle()does).- center
Optional. A single number giving the amplitude at the center of the circle (default = 0). Ring labels and the amplitude-to-radius mapping are guaranteed to agree.
- r_axis_angle
Optional. A single number giving the displacement (in degrees) along which the amplitude (radial) axis and its labels are drawn.
NULL(the default) places it automatically in the widest gap between the displacement spokes, so the amplitude labels never collide with a spoke label. Ignored whengrid = "cartesian", which draws no amplitude axis.- grid
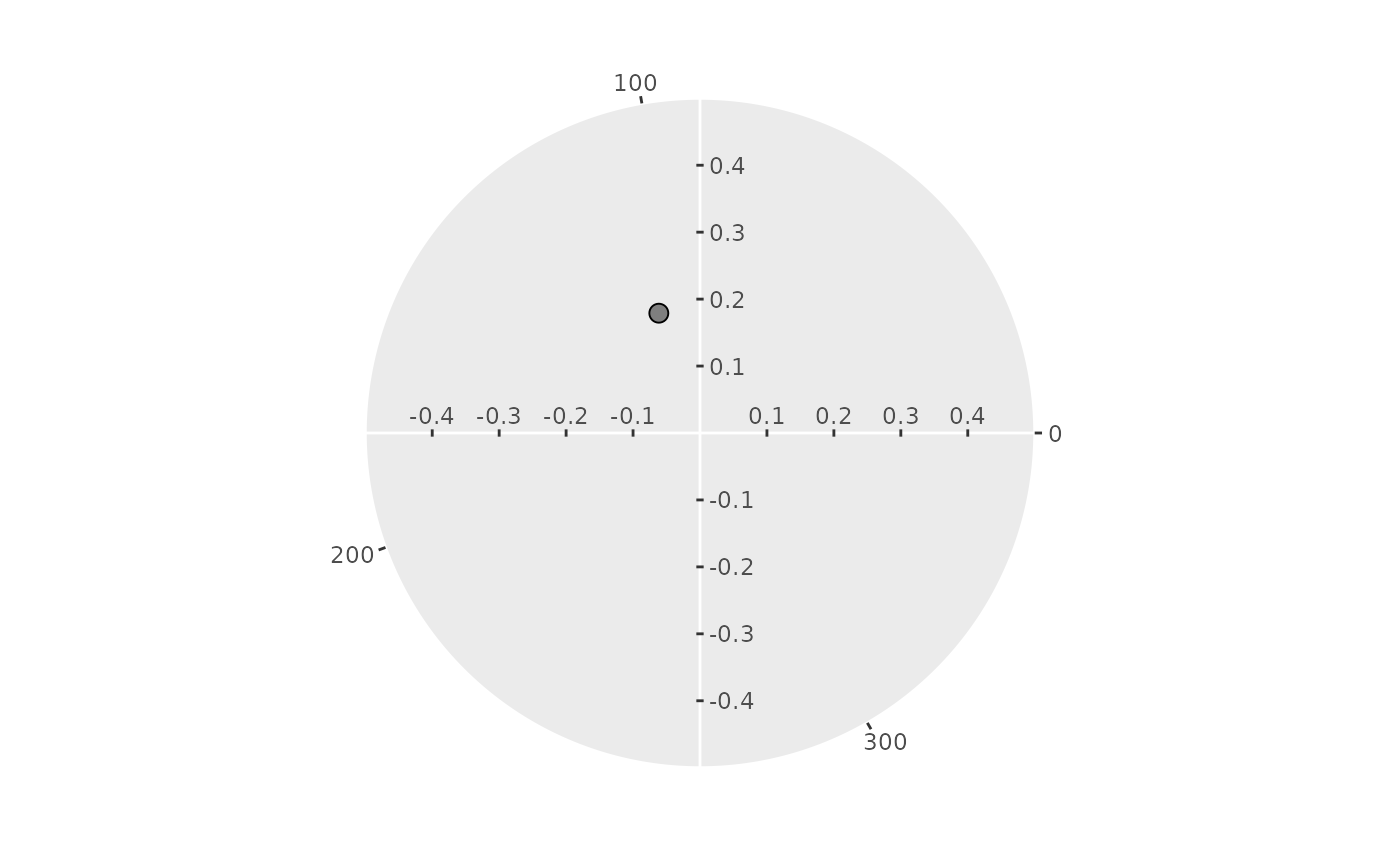
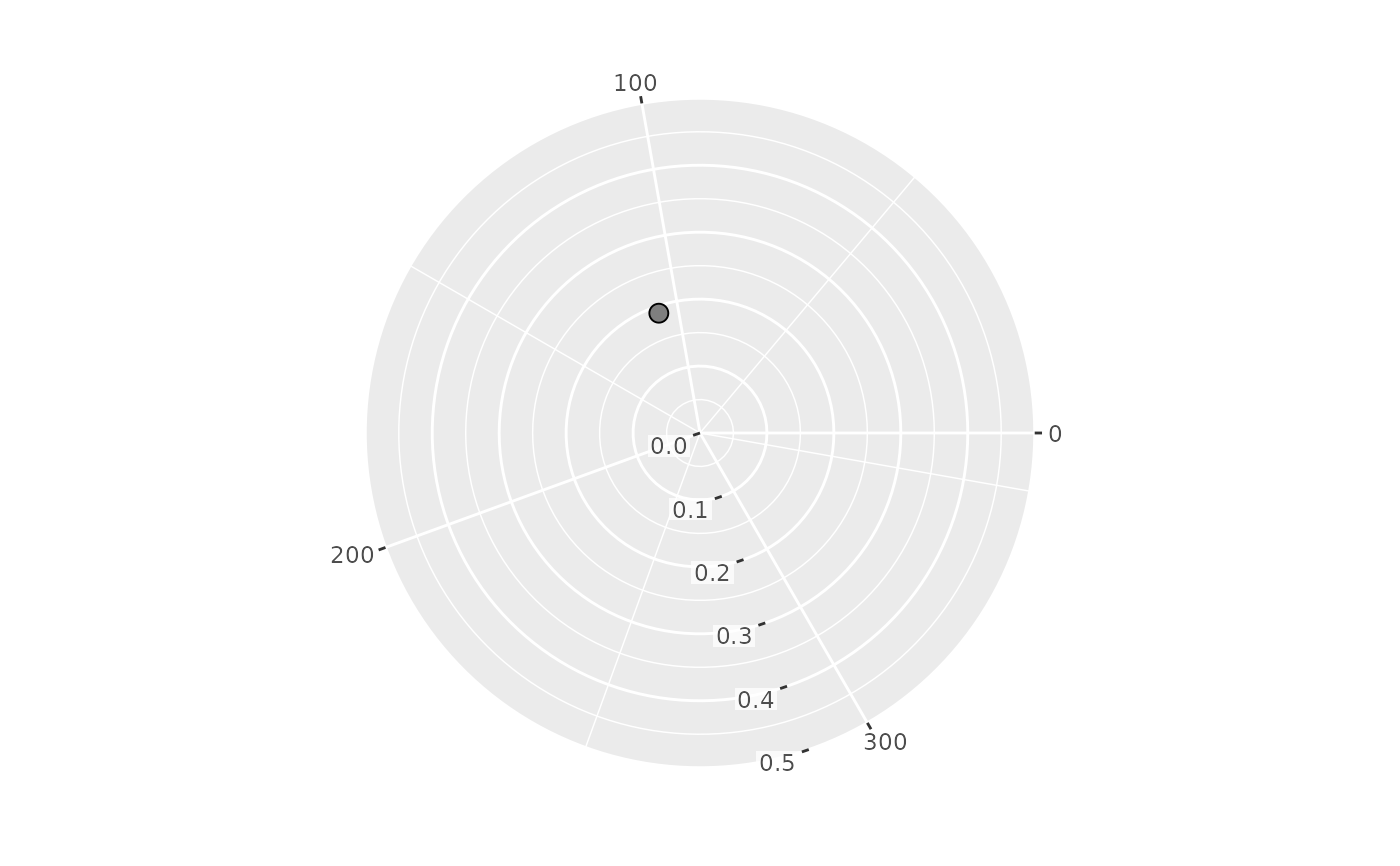
Optional. A single string naming the canvas furniture.
"polar"(the default) draws amplitude rings, displacement spokes and the amplitude axis."cartesian"draws one ring at the outer amplitude, a crosshair along displacements 0/180 and 90/270, and a tick mark with a signed label at each amplitude break between the center and the rim on every half-axis (the center and the rim value itself are not labelled), and no other ring, spoke or amplitude axis (the canvas of Nagy et al., 2019). The labels on the 180 and 270 halves are negative Cartesian coordinates, not negative amplitudes. The mapping of the data onto the canvas is the same in both modes.- ...
Reserved for future extensions; currently unused.
Details
coord_circumplex() subclasses ggplot2::coord_radial() and hard-pins the
angular convention (displacement 0 at the right, increasing counterclockwise,
the 0/360 range with no expansion) so the circumplex angle invariants survive
the transform. The amplitude at the circle's center and at its outer ring are
the radial limits, set once here.
See also
Other circumplex layers:
geom_ssm_arc(),
geom_ssm_ellipse(),
geom_ssm_path(),
geom_ssm_point(),
ggcircumplex(),
scale_x_circumplex(),
theme_circumplex()
Examples
data("jz2017")
res <- ssm_analyze(jz2017, scales = 2:9, measures = "NARPD")
ggplot2::ggplot(res$results) +
coord_circumplex(amax = 0.5) +
geom_ssm_point(ggplot2::aes(amplitude = a_est, displacement = d_est))
 # A Cartesian grid: one rim ring and a labelled crosshair, no rings or spokes
ggplot2::ggplot(res$results) +
coord_circumplex(amax = 0.5, grid = "cartesian") +
geom_ssm_point(ggplot2::aes(amplitude = a_est, displacement = d_est))
# A Cartesian grid: one rim ring and a labelled crosshair, no rings or spokes
ggplot2::ggplot(res$results) +
coord_circumplex(amax = 0.5, grid = "cartesian") +
geom_ssm_point(ggplot2::aes(amplitude = a_est, displacement = d_est))