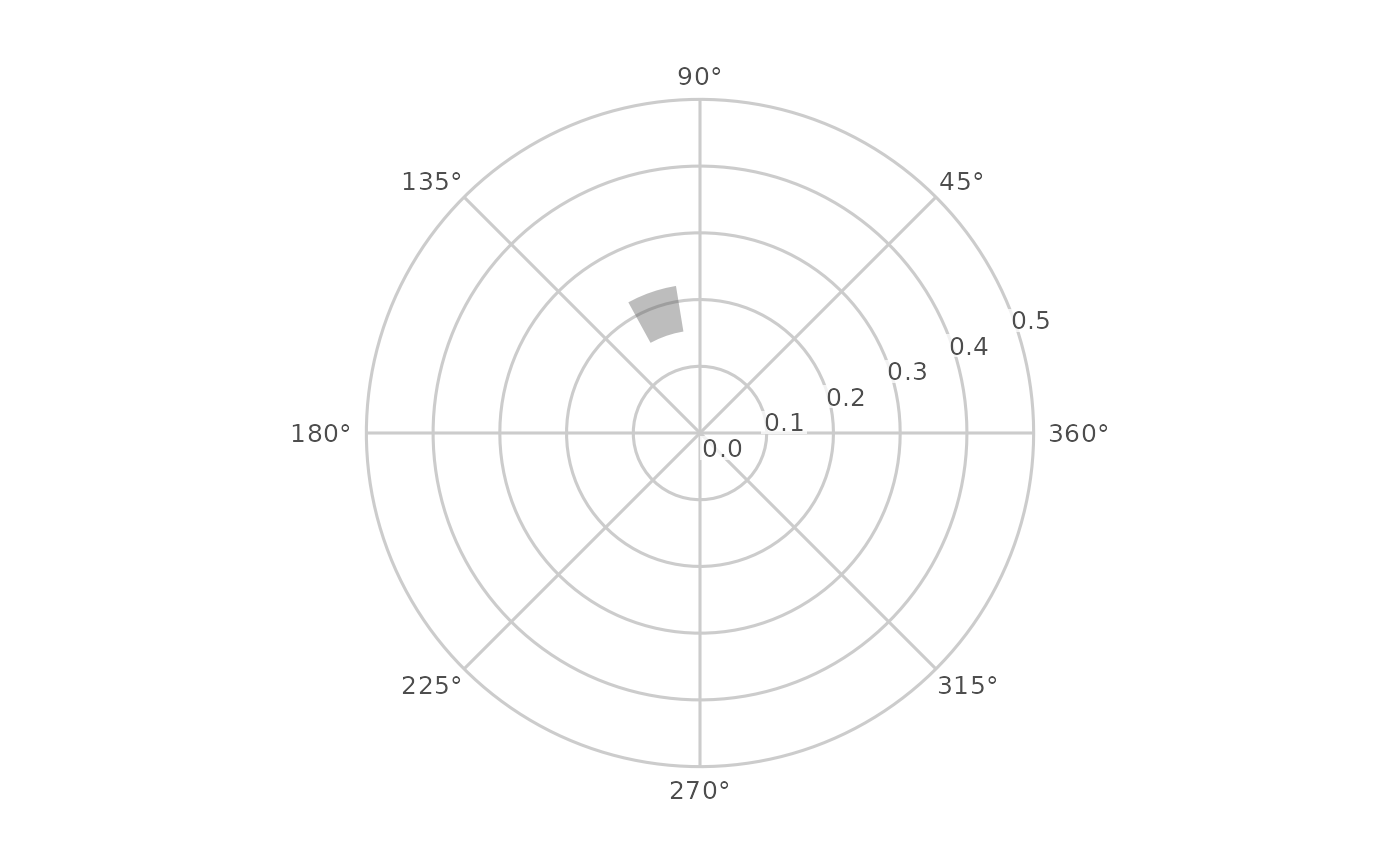
A ggplot2 layer that draws, for each profile, the wedge spanning its
amplitude confidence interval (radially) and its displacement confidence
interval (angularly) on a circumplex canvas built with coord_circumplex()
(for example the canvas from ggcircumplex()). The bounds are supplied
directly in SSM units; the coordinate system bends the (displacement,
amplitude) rectangle into an annular wedge.
Usage
geom_ssm_arc(
  mapping = NULL,
  data = NULL,
  stat = "identity",
  position = "identity",
  ...,
  amax = NULL,
  n = NULL,
  na.rm = TRUE,
  show.legend = NA,
  inherit.aes = TRUE
)
Arguments
- mapping, data, stat, position, show.legend, inherit.aes, ...
Standard ggplot2 layer arguments.
mappingmust supply theamplitude_min,amplitude_max,displacement_min, anddisplacement_maxaesthetics.- amax
(Deprecated) The amplitude represented by the outer ring is now owned by
coord_circumplex(); a value supplied here is ignored with a one-time note.- n
(Deprecated) Arc smoothness is now owned by the coordinate system, which curves the wedge automatically; a value supplied here is ignored with a one-time note.
- na.rm
If
FALSE, warn (with the dropped-row count) before removing profiles with an incomplete confidence region (a missing amplitude or displacement bound); ifTRUE(the default) remove them silently.
Details
Each arc spans counterclockwise from displacement_min to
displacement_max (both in degrees). Supply them in [0, 360] (a bound of
exactly 360 is the 0/360 pole under the package's LM = 360 labeling). A
displacement_min greater than displacement_max is read as an interval
that crosses the 0/360 seam and is drawn the short way across it (e.g.
350 -> 10 is a 20 degree arc, matching how the package stores a
displacement CI that straddles the boundary). The interval must describe
less than a full circle; bounds that imply a span of 360 degrees or more
(for example, values outside [0, 360]) are rejected, since they do not
name a unique arc.
See also
Other circumplex layers:
coord_circumplex(),
geom_ssm_ellipse(),
geom_ssm_path(),
geom_ssm_point(),
ggcircumplex(),
scale_x_circumplex(),
theme_circumplex()
Examples
data("jz2017")
res <- ssm_analyze(jz2017, scales = 2:9, measures = "NARPD")
ggcircumplex(octants(), amax = 0.5) +
  geom_ssm_arc(
    data = res$results,
    mapping = ggplot2::aes(
      amplitude_min = a_lci, amplitude_max = a_uci,
      displacement_min = d_lci, displacement_max = d_uci
    ),
    alpha = 0.4
  )